Inequalities symbols are mathematical signs used when values need comparison instead of exact equality. These symbols show whether something is larger, smaller, inside a range, above a limit, below a boundary, or connected through multiple conditions. Common examples include greater than (>), less than (<), greater than or equal to (≥), and less than or equal to (≤).
Math feels simple until numbers stop being equal.
At first, everything looks familiar.
Then suddenly small symbols start appearing.
A tiny arrow.
A strange line.
A sign pointing left.
Another pointing right.
And somehow a simple problem starts looking more complicated than expected.
That is where inequalities begin.
Instead of asking whether two values are exactly the same, inequalities focus on comparison.
One number may need to stay higher.
Another might need to remain lower.
Sometimes values belong inside a range.
Sometimes multiple conditions must work together before an answer makes sense.
These symbols appear far beyond classrooms.
They show up in algebra, graphing, programming, statistics, finance, engineering, computer science, and everyday situations where limits, restrictions, or conditions matter.
Related post: Halloween Symbols
What Are Inequalities Symbols?
Inequality symbols compare two quantities.
Instead of saying:
5 = 5
Inequalities allow statements like:
5 > 3
or
2 < 10
These comparisons help describe limits, ranges, restrictions, and conditions.
Why Inequalities Matter
Imagine trying to explain:
“Temperature must remain below 30.”
or
“Age must be at least 18.”
These situations require comparisons rather than exact values.
Inequalities make these relationships easier to write.
They help with:
- Defining boundaries
- Creating conditions
- Building graphs
- Solving equations
- Writing programming logic
- Modeling real situations
Basic Inequalities Symbols

These symbols appear first because nearly every advanced symbol grows from them.
Difference Between Equations And Inequalities
Equations and inequalities look similar.
They solve different problems.
| Equation | Inequality |
| Shows exact equality | Shows comparison |
| Usually produces exact answers | Frequently produces ranges |
| Uses = symbol | Uses >, <, ≥, ≤ |
| Example: x = 5 | Example: x > 5 |
Example:
Equation:
x = 10
Only one answer exists.
Inequality:
x > 10
Many answers become possible.
That difference changes how problems are solved.
1. Greater Than Symbol (>)
The value on the left exceeds the value on the right.
8 > 3
Eight is larger.
2. Less Than Symbol (<)
The quantity on the left stays below the value on the right.
2 < 7
3. Greater Than Or Equal To (≥)
The first value may either exceed or exactly match the second value.
x ≥ 5
4. Less Than Or Equal To (≤)
Allows values smaller than or exactly equal to the boundary.
5. Not Equal To (≠)
Shows two quantities do not match.
7 ≠ 4
Core Comparison Symbols Table
| Symbol | Name | Simple Meaning |
| > | Greater Than | Left side larger |
| < | Less Than | Left side smaller |
| ≥ | Greater Than Equal To | Larger or same |
| ≤ | Less Than Equal To | Smaller or same |
| ≠ | Not Equal | Different values |
Common Inequality Symbols Chart
This quick chart helps when you need fast reference.
| Symbol | Name | Meaning | Example |
| > | Greater Than | Left side larger | 8 > 3 |
| < | Less Than | Left side smaller | 2 < 7 |
| ≥ | Greater Than Equal To | Larger or same | x ≥ 5 |
| ≤ | Less Than Equal To | Smaller or same | x ≤ 10 |
| ≠ | Not Equal To | Values differ | 4 ≠ 7 |
| ∧ | AND Symbol | Multiple conditions together | x>2 AND x<9 |
| ∨ | OR Symbol | Alternative conditions | x<2 OR x>10 |
| ∩ | Intersection Symbol | Shared region | A ∩ B |
| ∪ | Union Symbol | Combined regions | A ∪ B |
Linear Inequalities Symbols
Linear inequalities appear when variables enter the picture.
Instead of comparing numbers alone, expressions become involved.
6. Single Variable Greater Than
x > 10
Shows values above a boundary.
7. Single Variable Less Than
y < 15
Shows values below a boundary.
8. Variable Greater Than Equal Boundary
Used when boundary values remain included.
9. Variable Less Than Equal Boundary
Useful when maximum limits exist.
10. Two Variable Linear Inequality
y > 2x + 1
Frequently appears during graphing.
Graphing Inequalities Symbols
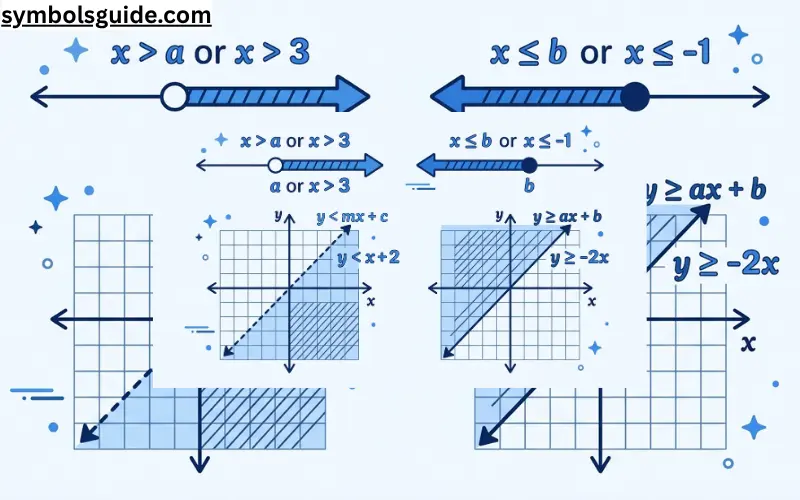
Graphing inequalities changes how symbols behave.
Instead of finding one answer, graphs usually show entire regions.
That is where graphing symbols become important.
11. Open Circle Symbol
○
An open circle means:
Boundary value excluded
x > 4
Since 4 itself does not belong to the solution, the circle stays open.
12. Closed Circle Symbol
●
A closed circle means:
Boundary included
x ≥ 4
This time 4 belongs inside the solution.
13. Shaded Region Symbol
Used when entire areas satisfy the inequality.
Instead of highlighting points individually, graphs shade all possible answers.
14. Boundary Line Symbol
Graphing inequalities often creates boundary lines separating valid and invalid regions.
15. Dashed Boundary Line
Dashed lines usually appear when boundary values remain excluded.
y > x
16. Solid Boundary Line
Solid lines appear when the boundary itself belongs inside the solution set.
17. Above Line Region Symbol
Shading above a line means solutions exist higher than the boundary.
18. Below Line Region Symbol
Solutions remain underneath the line.
19. Left Region Symbol
Shows valid solutions positioned toward smaller values.
20. Right Region Symbol
Represents larger value regions.
Compound Inequalities Symbols
Compound inequalities combine multiple conditions together.
Instead of solving one comparison, multiple comparisons work simultaneously.
21. Compound Less Than Symbol
2 < x < 10
Values must stay between both limits.
22. Compound Greater Than Symbol
5 < y < 20
Creates restricted ranges.
23. Inclusive Compound Inequality
Includes endpoints together with internal values.
24. Exclusive Compound Inequality
Excludes boundary values.
25. Double-Sided Boundary Symbol
Used when both minimum and maximum limits exist.
AND Inequalities Symbols
Many students confuse AND conditions first.
The easiest way:
Both conditions must work simultaneously.
26. AND Symbol
∧
Both statements remain true together.
x > 2 AND x < 9
27. Intersection Symbol
∩
Shows overlapping solution areas.
28. Shared Solution Region Symbol
Represents answers satisfying multiple restrictions.
29. Common Interval Symbol
Used when intervals overlap.
30. Simultaneous Condition Symbol
Multiple conditions operate together.
OR Inequalities Symbols
OR conditions behave differently.
Only one condition must work.
31. OR Symbol
∨
One condition, the other condition, or both.
32. Union Symbol
∪
Combines multiple solution regions.
33. Separate Region Symbol
Represents disconnected answers.
34. Alternative Solution Symbol
Shows multiple possible outcomes.
35. Multi-Interval Symbol
Used when answers appear in separate ranges.
Interval Notation Symbols
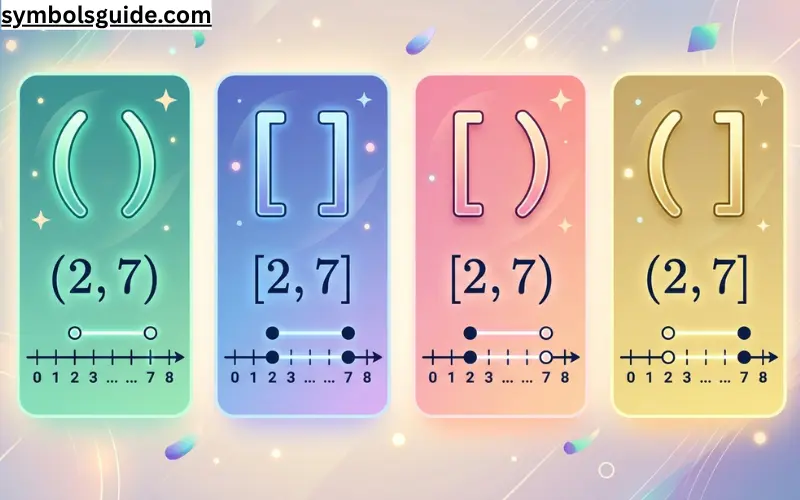
Interval notation compresses large solution sets into shorter forms.
36. Open Parenthesis Symbol (
Used when boundary values remain excluded.
37. Closed Bracket Symbol [
Used when endpoints remain included.
38. Open Interval Symbol
(2,7)
Values between boundaries only.
39. Closed Interval Symbol
[2,7]
Includes boundaries.
40. Half Open Interval Symbol
Mixes included and excluded endpoints.
Set Notation Inequality Symbols
Set notation appears frequently in advanced mathematics.
41. Set Builder Symbol
|
or
:
Defines conditions for valid values.
42. Element Symbol
∈
Shows membership inside sets.
43. Not Element Symbol
∉
Shows absence from sets.
44. Subset Symbol
⊂
Represents contained sets.
45. Superset Symbol
⊃
Represents larger containing sets.
Why Students Struggle With Inequalities
Many people understand equations quickly.
Inequalities feel different.
Because one small symbol change can completely change answers.
x = 5
One answer.
But:
x > 5
Infinite possible answers.
That difference creates confusion.
Programming Inequality Symbols
Programming languages constantly use inequalities.
Without them, software could not make decisions.
Conditions like:
“Is user old enough?”
“Is score higher?”
“Did value exceed the limit?”
All depend upon comparisons.
46. Greater Than Operator
Used when code checks whether one value exceeds another.
if x > 5
47. Less Than Operator
Checks whether values remain smaller.
48. Greater Equal Operator
Frequently used when minimum requirements exist.
age >= 18
49. Less Equal Operator
Useful when upper limits exist.
50. Not Equal Operator
Programming languages commonly write:
!=
instead of mathematical notation.
51. Triple Equal Symbol
===
Used in some languages for strict comparisons.
52. Strict Not Equal Symbol
!==
Checks inequality while considering data type.
53. Conditional Comparison Symbol
Appears inside decision statements.
54. Boolean Comparison Symbol
Produces true or false outcomes.
55. Expression Evaluation Symbol
Used while comparing calculated results.
Logic Inequalities Symbols
Logical systems combine comparisons together.
56. Logical AND Symbol
∧
Both statements remain valid.
57. Logical OR Symbol
∨
Only one statement must work.
58. Logical NOT Symbol
¬
Reverses truth values.
59. Implication Symbol
→
Shows one statement leading toward another.
60. Double Implication Symbol
↔
Represents mutual relationships.
61. Universal Quantifier Symbol
∀
Used when statements apply everywhere.
62. Existential Quantifier Symbol
∃
Shows at least one valid case exists.
63. Therefore Symbol
∴
Indicates conclusions.
64. Because Symbol
∵
Shows reasoning.
65. Contradiction Symbol
⊥
Represents impossible situations.
Advanced Mathematical Inequality Symbols
Mathematics contains many specialized comparison symbols.
These appear more frequently in higher-level studies.
66. Much Greater Than Symbol
≫
Shows extremely large differences.
67. Much Less Than Symbol
≪
Represents substantially smaller quantities.
68. Approximately Equal Symbol
≈
Shows close values rather than exact matches.
69. Equivalent Symbol
≡
Used for equivalence relationships.
70. Proportional Symbol
∝
Shows changing relationships between quantities.
71. Asymptotically Less Than Symbol
≲
Used in advanced mathematics.
72. Asymptotically Greater Symbol
≳
Appears in higher-level analysis.
73. Precedes Symbol
≺
Shows ordering relationships.
74. Succeeds Symbol
≻
Represents following relationships.
75. Comparable Symbol
≼
Shows ordered comparisons.
Statistics Inequality Symbols
Statistics relies heavily upon comparisons.
76. Probability Less Than Symbol
P(X<5)
77. Confidence Interval Boundary Symbol
Defines acceptable statistical ranges.
78. Critical Value Symbol
Marks decision thresholds.
79. Statistical Significance Symbol
Frequently connected with:
p < 0.05
80. Distribution Boundary Symbol
Defines regions within distributions.
Calculus Inequality Symbols
Calculus expands inequalities into changing systems.
81. Limit Comparison Symbol
Used while studying approaching values.
82. Derivative Constraint Symbol
Applies restrictions during optimization.
83. Integral Boundary Symbol
Sets calculation ranges.
84. Optimization Constraint Symbol
Common inside maximum and minimum problems.
85. Domain Restriction Symbol
Controls valid inputs.
Economics and Business Inequality Symbols
Businesses constantly compare numbers.
86. Profit Greater Than Cost Symbol
Used during profitability analysis.
87. Demand Constraint Symbol
Shows limitations.
88. Resource Allocation Symbol
Represents restricted resources.
89. Budget Limit Symbol
Defines spending boundaries.
90. Production Constraint Symbol
Used during optimization problems.
Additional Inequality Symbols and Advanced Notations
91. Strict Inequality Symbol
Strict inequalities exclude boundary values.
x > 5
or
y < 10
Boundary numbers stay outside.
92. Weak Inequality Symbol
Weak inequalities allow boundary values.
x ≥ 5
or
y ≤ 10
93. Absolute Value Inequality Symbol
Absolute value inequalities measure distance rather than direction.
|x| < 4
94. Double Absolute Value Inequality
Used when multiple restrictions exist inside absolute value expressions.
95. Polynomial Inequality Symbol
Appears when polynomial expressions become part of comparisons.
x² − 4 > 0
96. Rational Inequality Symbol
Used when fractions or rational expressions require comparison.
(x+1)/(x−2) > 0
97. Exponential Inequality Symbol
Compares exponential expressions.
2ˣ > 16
98. Logarithmic Inequality Symbol
Used while comparing logarithmic functions.
log(x) > 2
99. System Of Inequalities Symbol
Multiple inequalities working together.
x > 0
y < 5
100. Piecewise Inequality Symbol
Appears when rules change across intervals.
Frequently used in advanced algebra and calculus.
101. Matrix Inequality Symbol
Used while comparing matrices and matrix conditions.
More common in advanced mathematics.
102. Optimization Constraint Symbol
Appears inside optimization problems where solutions must satisfy restrictions.
103. Feasible Solution Region Symbol
Represents solution areas satisfying every condition simultaneously.
104. Domain Restriction Inequality Symbol
Restricts valid inputs.
x > 0
used because logarithms cannot accept negative inputs.
105. Range Restriction Symbol
Restricts possible outputs.
Common during function analysis.
106. Infinite Solution Set Symbol
Represents inequalities extending endlessly in one or multiple directions.
x > 1
contains infinitely many possible answers.
Why Learning Inequalities Becomes Easier Later
Most people struggle initially because inequalities feel unfamiliar.
Then something changes.
The symbols stop looking random.
You begin seeing patterns.
Greater.
Smaller.
Boundaries.
Restrictions.
Ranges.
Once those ideas become familiar, inequalities stop feeling complicated.
How To Solve Inequalities Step By Step
Many people understand symbols.
Solving them feels harder.
A simple process usually works.
Isolate Variables
Move numbers and terms until the variable remains easier to work with.
Example:
x + 3 > 8
Subtract 3.
Result:
x > 5
Simplify Expressions
Remove unnecessary complexity.
Smaller expressions create fewer mistakes.
Watch Negative Multiplication Carefully
This is where many people struggle.
When multiplying or dividing inequalities by negative numbers:
The symbol direction changes.
Example:
-2x > 10
Divide by -2:
x < -5
Notice:
The inequality flipped.
Verify Solutions
Check answers by substituting values back.
This catches mistakes early.
How To Graph Inequalities
Graphing looks intimidating.
Usually the process repeats.
First: Draw Boundary
Convert inequality into equation form.
Second: Decide Line Type
Use:
- Dashed line → excluded boundary
- Solid line → included boundary
Third: Shade Correct Region
Ask:
“Which side satisfies the inequality?”
Shade that region.
Linear Inequalities Symbols and Graphing Example
Consider:
y > x + 2
Process:
- Draw line:
y = x + 2
- Use dashed boundary
- Shade above line
The graph now shows every valid solution.
Common Mistakes People Make With Inequalities
Small mistakes create large problems.
Forgetting To Flip Symbols
Negative multiplication causes many errors.
Always check this step.
Mixing Open And Closed Circles
Students frequently confuse:
○ excluded
● included
Graphing Wrong Regions
Many graphs become incorrect simply because shading occurs on the wrong side.
Testing one point usually fixes this.
Ignoring Boundaries
Boundary values matter.
Especially with:
≤
and
≥
Real Life Examples Of Inequalities

Inequalities appear more frequently than people realize.
Examples:
Age Restrictions
Age ≥ 18
Temperature Limits
Temperature < 30
Speed Restrictions
Speed ≤ 60
Budget Planning
Expenses ≤ Income
Why Inequalities Matter Beyond School
People sometimes assume inequalities only belong inside classrooms.
Actually they appear in:
- Engineering
- Economics
- Computer science
- Machine learning
- Data analysis
- Finance
- Business optimization
- Statistics
Restrictions exist everywhere.
Inequalities simply provide a way to write them.
How To Read Inequality Symbols Easily
Many people struggle with inequalities because symbols look similar.
A simple trick helps.
Greater Than Symbol (>)
The wider side faces the larger value.
Example:
8 > 3
Eight stays larger.
Less Than Symbol (<)
The narrow side points toward smaller values.
Example:
2 < 7
Two remains smaller.
Greater Than Or Equal To Symbol (≥)
This symbol combines:
- Greater than
- Equal to
Meaning:
The value may exceed the boundary or match it.
Less Than Or Equal To Symbol (≤)
Allows:
- Smaller values
- Equal values
Boundary values stay included.
See Also
- 97+ Occult Symbols and Meanings With Names & Secrets
- 115+ Powerful Spiritual Symbols & Meanings Hidden Wisdom
- 101+ Genogram Symbols and Meanings: Complete Guide
- 108+ Geometry Symbols and Meanings with Names Guide
- 116+ Halloween Symbols and Meanings Explained
FAQs
What are inequalities symbols?
Inequalities symbols compare quantities and show relationships between values rather than exact equality.
What are linear inequalities symbols?
Linear inequalities symbols compare algebraic expressions involving variables and linear equations.
What are graphing inequalities symbols?
These symbols help visualize solution regions using boundaries, shading, open circles, and closed circles.
What are AND and OR inequalities symbols?
AND conditions require multiple statements simultaneously.
OR conditions allow multiple possible conditions.
Why do inequality signs flip with negative numbers?
Multiplying or dividing by negative numbers reverses order relationships.
Because of that, inequality direction changes.
What is the difference between ≤ and < ?
<
excludes boundary values.
≤
includes them.
Conclusion
Inequality symbols can look confusing at first.
Small signs.
Strange arrows.
Lines that seem almost identical.
For many people, the difficult part is not mathematics itself.
It is learning what these symbols are trying to say.
Eventually, something changes.
You stop focusing only on symbols and start noticing what they actually describe.
Comparisons.
Boundaries.
Conditions.
Possible ranges.
That shift makes inequalities easier to understand.
Because inequalities were never simply about placing symbols between numbers.
They exist to explain how values relate, where limits exist, and how different quantities interact with each other.
Once that idea becomes familiar, the symbols stop feeling complicated and start feeling useful.